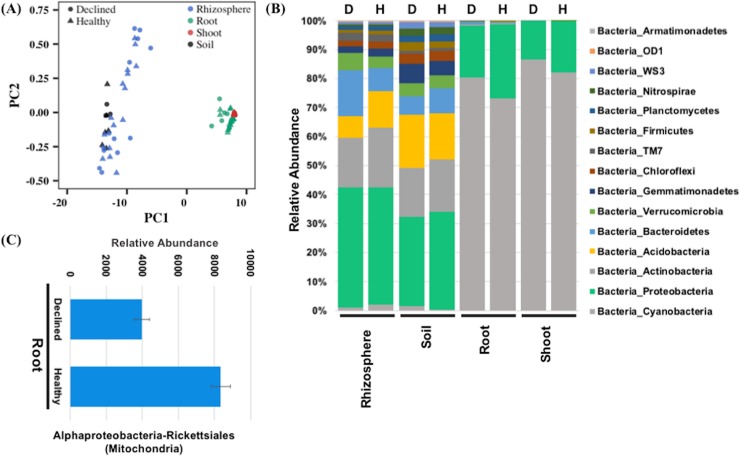
Fig 6. Analysis of bacterial communities in root, shoot, soil, and rhizosphere samples from asymptomatic and symptomatic ‘HoneyCrisp’ apple trees as identified by sequencing 16S regions.
(A) Biplot from principal component analysis of the diversity indices obtained from 16S analysis of different samples, (B) Abundance of different bacterial classes in the rhizosphere, soil, root, and shoot samples, (C) Bacterial classes that show a significantly differential abundance between healthy and declined apple trees.

