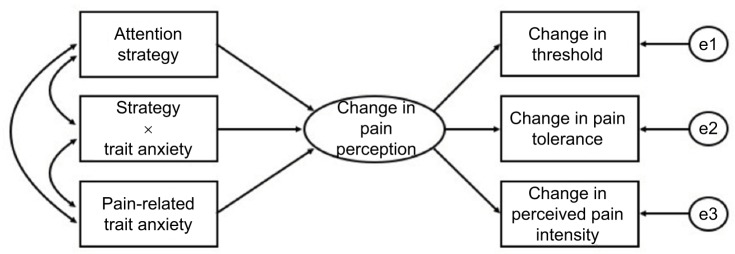
Figure 3.
Predicted attention model.
Notes: This figure depicts the structural equation modeling used to analyze the influence of attention strategies, pain-related anxiety, and the moderating effect of pain-related anxiety on the change in pain perception. The rectangles ([img]) represent observed variables, while the ellipses ([img]) represent the unobserved latent factors. The single-headed arrows with solid lines (→) represent the path coefficient for regression of one variable on another. The double-headed arrows (↔) represent covariances or correlations between pairs of variables. Trait anxiety indicates pain-related trait anxiety. “×” in Strategy × Trait anxiety box indicates the interaction between attention strategy and pain-related trait anxiety. e1 indicates measurement error for the change in pain threshold reading; e2 indicates measurement error for the change in pain tolerance reading; e3 indicates measurement error for the change in perceived pain intensity rating.

