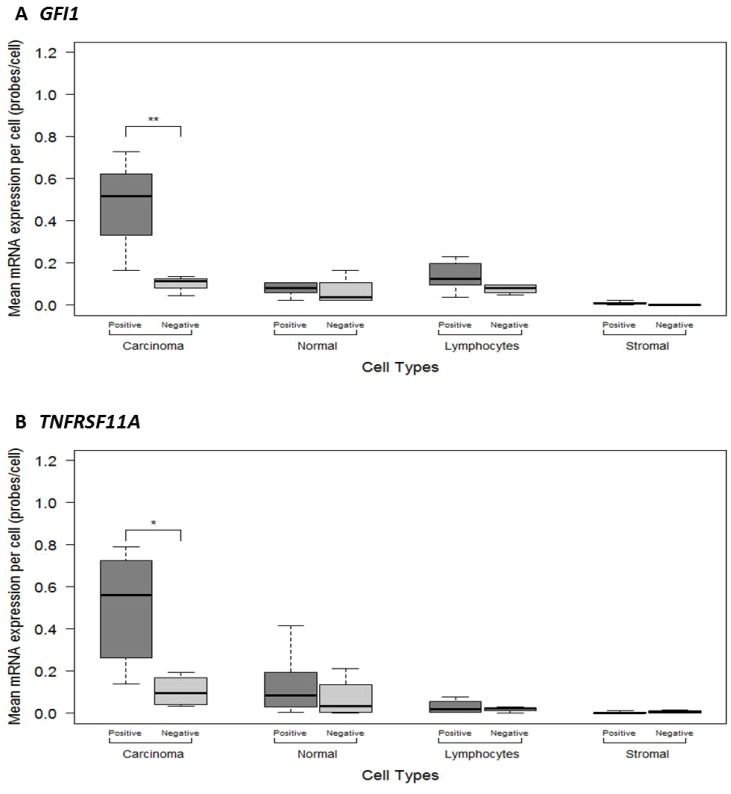
Figure 3.
ImageJ manual method quantitative measurements of mRNA expression levels in different cells types between the 10 colorectal cancer FFPE histological sections categorised as showing Negative or Positive mRNA expression for (A) GFI1 (B) TNFRSF11A. Significant p-values are: <0.001 = ***, <0.01 = **, <0.05 = *.

