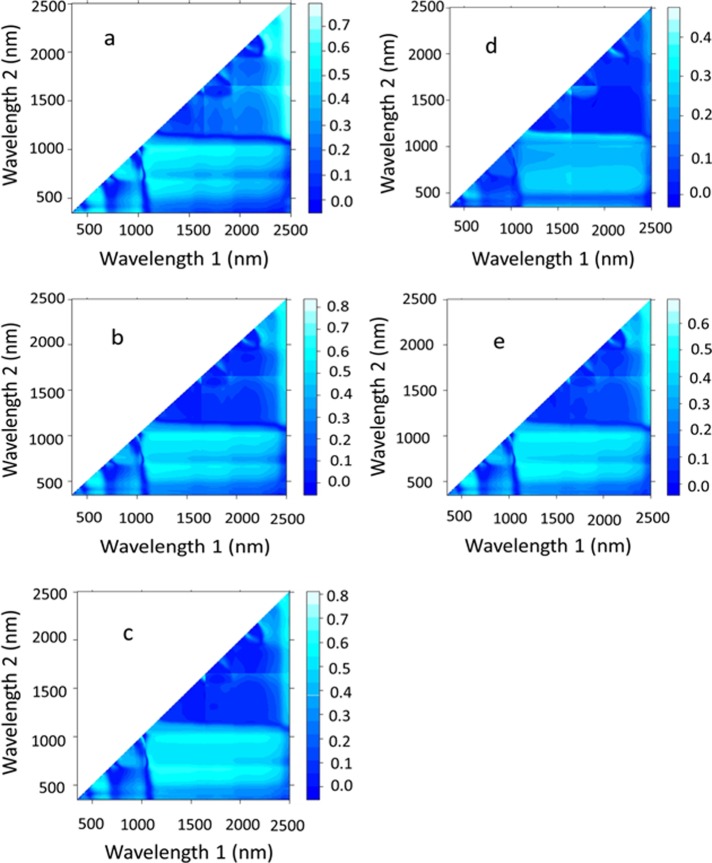
Fig 1. Contour maps of coefficients of determination (R²) for all dual wavelength combinations in the spectral range of 350–2500 nm as normalized difference spectral indices.
The pooled data of replications, irrigation rates, plant densities, and season for each agronomic parameter i.e., green leaf area (a), aboveground dry weight (b), grain yield (c), and water use efficiency (d), and for all agronomic parameters combined were used.

