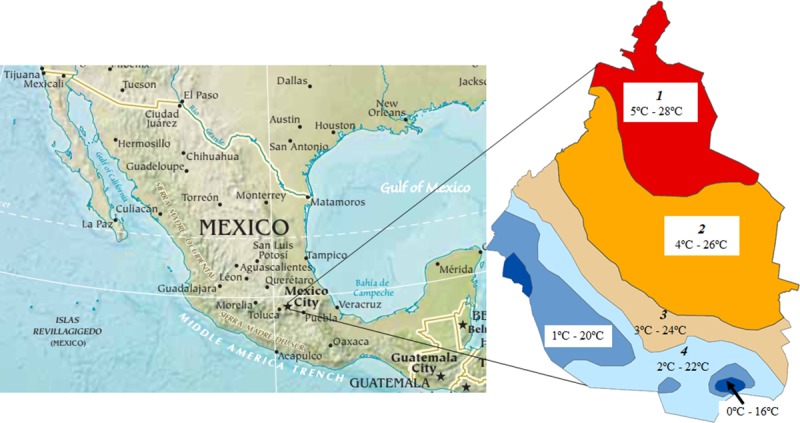
Fig 1. Mexico city location.

Lowest and highest average annual temperatures in the city are shown. Map modified from https://www.cia.gov/library/publications/the-world-factbook/attachments/docs/original/north_america.pdf?1528326233.

Lowest and highest average annual temperatures in the city are shown. Map modified from https://www.cia.gov/library/publications/the-world-factbook/attachments/docs/original/north_america.pdf?1528326233.