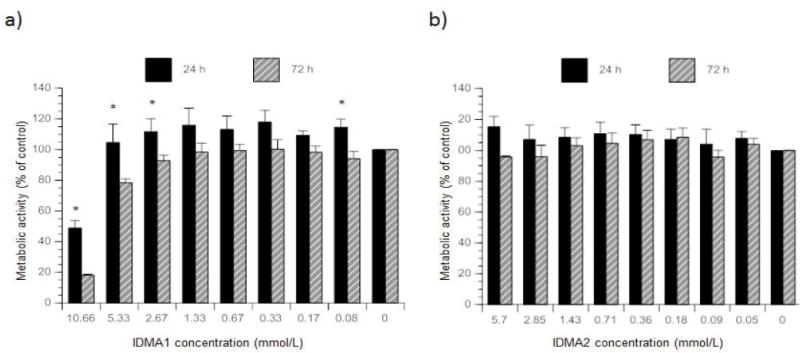
Figure 3.

Metabolic activity of fibroblasts exposed to various IDMA1 (a) or IDMA2 (b) concentrations. Indicated are mean value ± SEM for five or more independent replicates tested in triplicate. * indicates P ≤ 0.05 when comparing exposure time within a monomer concentration.
