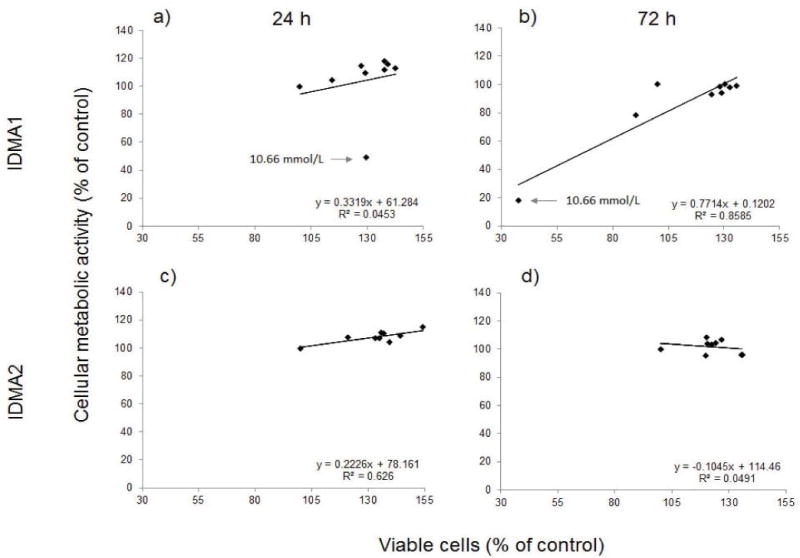
Figure 4.

Correlation between the cellular metabolism and viability of fibroblasts exposed to IDMA1 (a and b) or IDMA2 (c and d) for 24 or 72 h, respectively. Data represent five or more independent replicates. → indicates cellular response observed with 10.66 mmol/L IDMA1.
