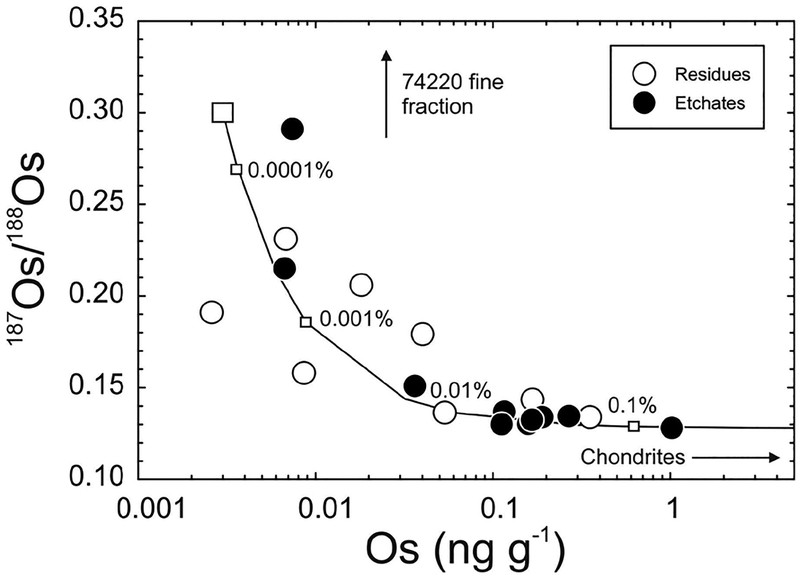
Figure 30.
187Os/188Os versus Os concentration for lunar pyroclastic glass bead etchate and residue experiments. Curve shows mixing between a hypothetical indigenous green glass composition (0.003 ng.g−1 Os; 187Os/188Os = 0.3) and an average ordinary chondrite composition (580 ng.g−1; 187Os/188Os = 0.128). Percentages (by mass) of the chondritic component are labelled. Figure adapted from Walker et al. (2004).

