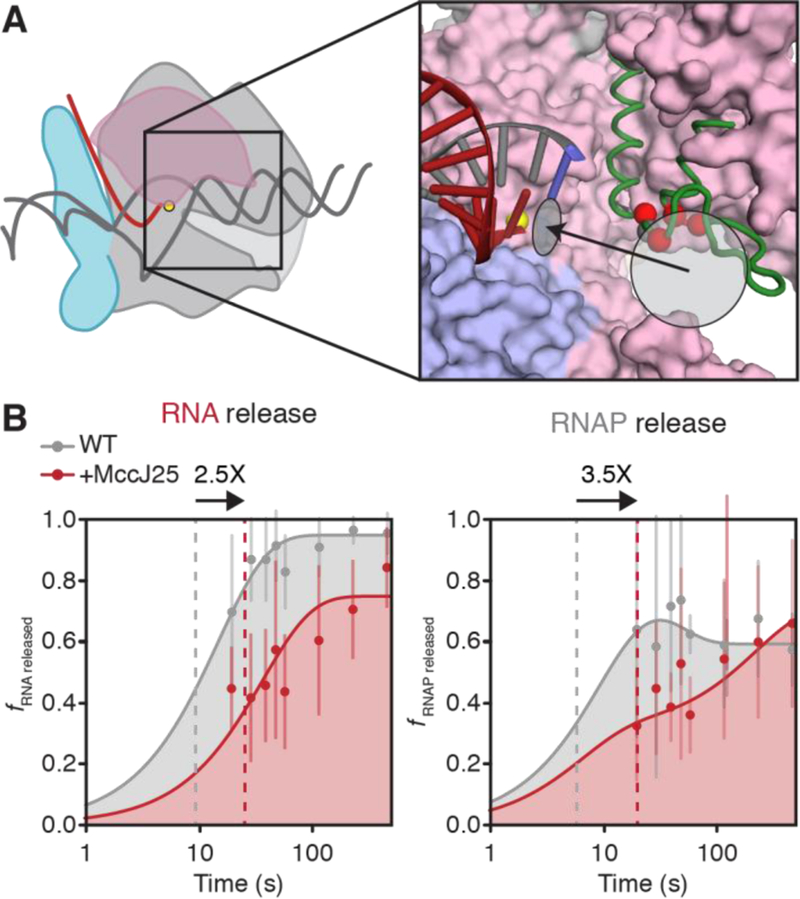
Figure 6.

Evaluation of RNA and RNAP dissociation rates in the presence of MccJ25. (A) MccJ25 bind the TL and the RNAP secondary channel. Red spheres indicate the Cα atoms of TL residues that confer MccJ25 resistance in mutational screens [41]. The grey sphere indicates the Cα atom of β′T931. The light grey circle indicates the location of the RNAP secondary channel and the black arrow indicates the path of NTP into the active site, light grey ellipse. The RNA-DNA hybrid is shown; other nucleic-acid components are omitted for clarity (red, RNA; grey, DNA; blue, template DNA base positioned in the RNAP active site). Core RNAP components are derived from PDB ID: 6ALF [27]; green, unfolded TL, PDB ID: 2O5J. (B) Semi-log plots of RNA and RNAP release rates at thisL. When relevant, MccJ25 is added 5 s after addition of chase NTPs. RNA dissociation was determined as the fraction of RNA released into the reaction supernatant relative to total RNA at the terminator site; RNAP dissociation was determined as the fraction of RNAP released into the reaction supernatant relative to the amount of total RNAP within the reaction mixture multiplied by the TE. Grey curves are the same as those in Figures S5A–B; red curves represent RNA and RNAP release from WT RNAP in the presence of 100 μM MccJ25. Dashed lines represent the time at which half of the maximal released RNA was achieved over the time course. Arrows on top of plots represent the fold-change in the time it takes for half-maximal release to occur upon treatment with MccJ25. Error bars represent the standard deviation at n = 3.
