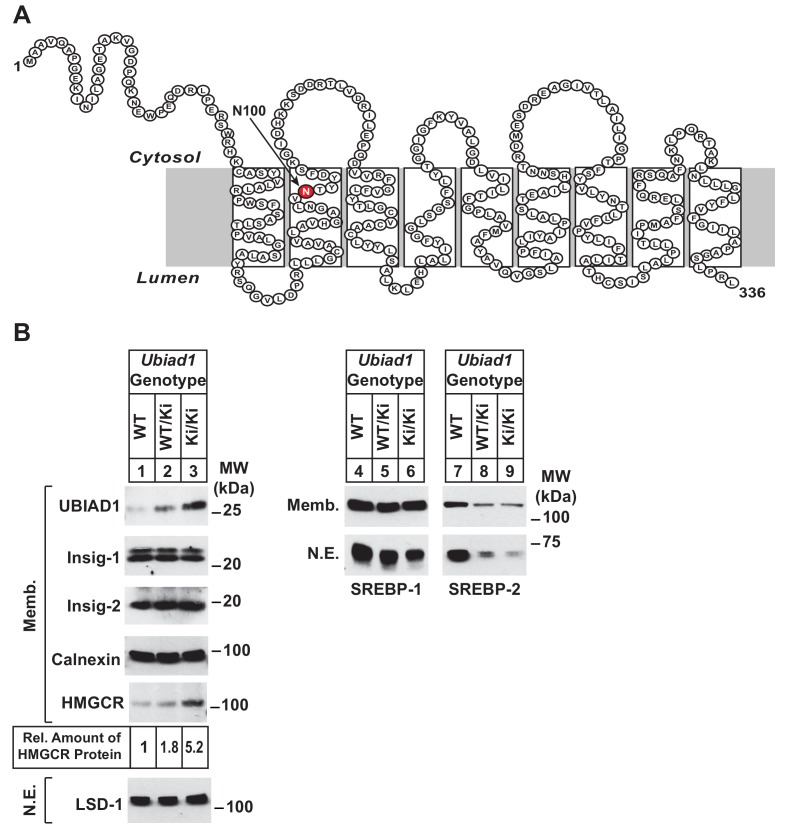
Figure 1. Accumulation of HMGCR protein in livers of Ubiad1Ki/Ki mice with mixed C57BL/6 × 129 genetic background.
(A) Amino acid sequence and predicted topology of mouse UBIAD1 protein. Asparagine-100 (N100), which corresponds to the most frequently mutated amino acid residue in SCD, is enlarged, shaded in red and indicated by an arrow. (B) Male WT, Ubiad1WT/Ki, and Ubiad1Ki/Ki littermates (8–9 weeks of age, eight mice/group) were fed an ad libitum chow diet prior to sacrifice. Livers of the mice were harvested and subjected to subcellular fractionation as described in ‘Materials and methods.’ Aliquots of resulting membrane (Memb.) and nuclear extract (N.E.) fractions (80–160 µg of total protein/lane) for each group were pooled and subjected to SDS-PAGE, followed by immunoblot analysis using antibodies against endogenous HMGCR, SREBP-1, SREBP-2, UBIAD1, Insig-1, Insig-2, calnexin, and LSD-1. Although shown in a separate panel, LSD-1 serves as a loading control for the nuclear SREBP immunoblots. The amount of hepatic HMGCR protein in Ubiad1Ki/Ki mice was determined by quantifying the band corresponding to HMGCR using ImageJ software.


