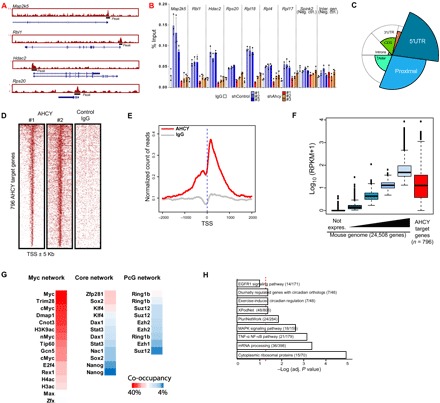
Fig. 3. AHCY occupies transcription start sites (TSS) of highly expressed genes in ESCs.

(A) Genomic visualization of AHCY ChIP-seq at several target sites. (B) AHCY ChIP-seq validation by ChIP-qPCR at TSS of AHCY target genes (Map2k5, Rbl1, Hdac2, Rps20, Rpl18, Rpl4, and Rpl17) and AHCY nontarget genomic regions (TSS of Spink2 and intergenic region at Chr15) as a negative control. ChIP-qPCRs were performed in shControl cells (n = 3) and shAhcy-KD ESCs with three independent shRNAs, showing the specific reduction in AHCY binding in shAhcy-KD ESCs (mean ± SD of three technical replicates). IgG, immunoglobulin G. (C) Genomic distribution of ChIP-seq peaks of AHCY. The spie chart represents the distribution of AHCY peaks corrected by the genome-wide distribution of each gene genomic feature (indicated in the background circle distribution). The spie charts indicate that AHCY preferentially occupies TSS neighborhood regions, including 5′ untranslated region (5′UTR) and proximal promoter regions. (D) Heat map showing the AHCY ChIP-seq occupancy profile around TSS (±5 kb) in two independent ChIP-seq replicates, with IgG as a negative control. (E) Meta-gene plot showing the AHCY ChIP-seq occupancy profile (red line) around TSS (±2 kb). IgG distribution is indicated by the gray line. (F) Box plots indicating the gene expression for the whole transcriptome in naïve ESCs, fractionated into five groups, from non-expressed genes (black box plot) to the highly expressed genes (light blue box plot). The red box plot indicates the expression of AHCY target genes. (G) Percentage of AHCY co-occupancy with chromatin factors from Myc, core, and PcG networks. (H) Pathway enrichment analysis of AHCY target genes. EGFR1, epidermal growth factor receptor 1; MAPK, mitogen-activated protein kinase; TNF-α, tumor necrosis factor–α; and NF-κB, nuclear factor κB.
