
Fig. 2. Generation of mice with a DMD exon 44 deletion.
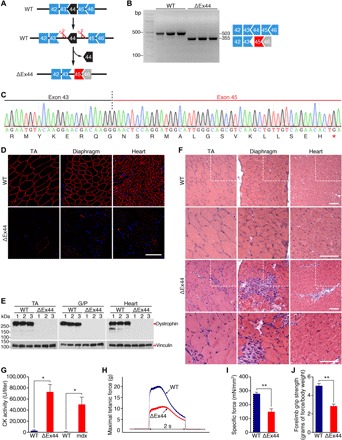
(A) CRISPR-Cas9 editing strategy used for generation of mice with exon 44 deletion (ΔEx44). Exon 45 (red) is out of frame with exon 43. (B) RT-PCR analysis of TA muscles to validate deletion of exon 44. RT-PCR primers were in exons 43 and 46, and the amplicon size is 503 bp for WT mice and 355 bp for ΔEx44 DMD mice. RT-PCR products are schematized on the right (n = 3). (C) Sequencing of RT-PCR products from ΔEx44 DMD mouse muscle confirmed deletion of exon 44 and generation of a premature stop codon in exon 45, indicated by red asterisk. (D) Dystrophin staining of the TA, diaphragm, and heart of WT and ΔEx44 DMD mice. Dystrophin is shown in red. Nuclei are marked by DAPI stain in blue. Scale bar, 100 μm. (E) The Western blot analysis shows loss of dystrophin expression in the TA, gastrocnemius/plantaris (G/P) muscle, and heart of ΔEx44 mice. Vinculin is the loading control (n = 3). (F) H&E staining of the TA, diaphragm, and heart. Note extensive inflammatory infiltrate and centralized myonuclei in ΔEx44 sections. Inset boxes indicate areas of magnification shown below. Scale bars, 50 μm. (G) Serum creatine kinase (CK), a marker of muscle damage and membrane leakage, was measured in WT (C57BL/6 and C57BL/10), ΔEx44, and mdx mice. Data are represented as mean ± SEM. Unpaired Student’s t test was performed. *P < 0.005 (n = 6). (H) Representative trace of maximal tetanic force of EDL muscles in WT (blue) and ΔEx44 mice (red). P < 0.005 (n = 6). (I) Specific force of EDL muscles in WT (blue) and ΔEx44 mice (red). Data are represented as mean ± SEM. Unpaired Student’s t test was performed. **P < 0.001 (n = 6). (J) Forelimb grip strength analysis of WT and ΔEx44 mice. Data are represented as mean ± SEM. Unpaired Student’s t test was performed. **P < 0.001 (n = 6).