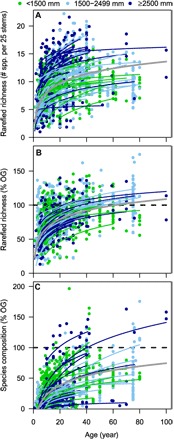
Fig. 2. Absolute recovery of species richness and relative recovery of species richness and composition in relation to stand age for Neotropical secondary forests.

Each line indicates predicted recovery per site based on the site-specific intercept and slope from the mixed-effects models. Lines span the age range of secondary forest per site; symbols indicate the individual plots. Dry forests (annual rainfall of <1500 mm year−1) are indicated in green, moist forests (1500 to 2499 mm year−1) are indicated in light blue, and wet forests (≥2500 mm year−1) are indicated in dark blue. The gray line indicates the average predicted recovery rate for a site that is recovering after shifting cultivation, with all other predictors kept constant at the mean. (A) Rarefied species richness (per 25 stems; n = 56 sites). (B) Relative recovery of rarefied species richness [as a percentage of old-growth (% OG) forest; n = 45 sites]. The black dashed line indicates 100% recovery to the species richness of old-growth forest. (C) Relative recovery of species richness (n = 45 sites) based on the Chao-Jaccard index. The black dashed line indicates 100% recovery to the mean similarity in species composition (0.47 ± 0.040 SE) between old-growth plots in the same site averaged across the 41 sites with at least two old-growth plots to account for within-site variation in composition across old-growth plots.
