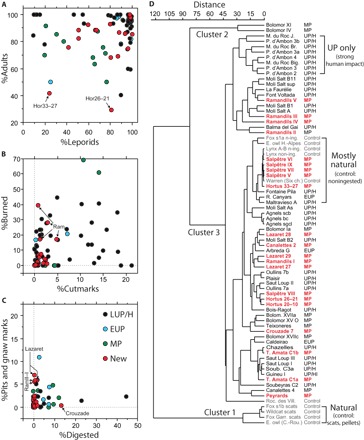
Fig. 4. Comparisons of different attributes of leporid assemblages.

These comparisons include scatterplots of %NISP of (A) leporids versus adults; (B) burned versus cutmarked specimens; and (C) specimens with pits and/or gnaw mark versus digestion damage. (D) Cluster analysis of five taphonomic attributes expressed in percentage (see text). Data points in the scatterplots correspond to assemblages analyzed for this study (red) and published MP (green), EUP (blue), and LUP/H sites (black). In (D), the newly studied assemblages are shown in bold red, whereas modern control assemblages are shown in gray.
