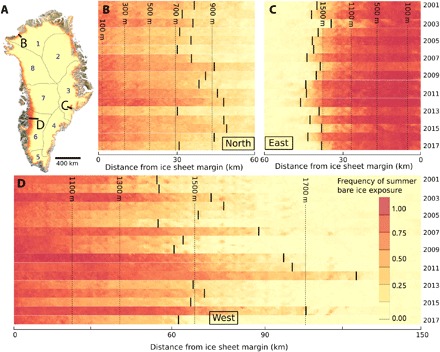
Fig. 1. Interannual variations in frequency of summer bare ice exposure around the Greenland Ice Sheet over the study period (2001–2017).

A value of 1 indicates that bare ice was observed in every non–cloud contaminated summer June, July, and August (JJA) MODIS observation. Satellite-derived bare ice exposure maps were used to delineate the end-of-summer (maximum) snowline elevation (represented by vertical black lines) for each year. (A) Pan-Greenland bare ice exposure averaged over the 2001–2017 study period. Black lines denote the IMBIE sectors used for regional analysis. Numbered labels are as follows: 1, North; 2, Northeast; 3, East; 4, Southeast; 5, South; 6, Southwest; 7, West; and 8, Northwest Greenland. (B) Frequency of bare ice exposure and snowline elevation at Humboldt Glacier, North Greenland. (C) Frequency of bare ice exposure and snowline elevation at Kangerlussuaq Glacier, East Greenland. (D) Frequency of bare ice exposure and snowline elevation across the K-transect of automated weather stations (AWSs) in Southwest Greenland. The location of each transect is displayed in (A). Note that the x-axis scale is the same for (B) to (D).
