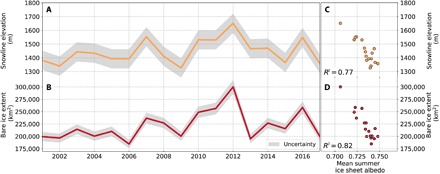
Fig. 2. Interannual variations in observed end-of-summer snowline elevation and bare ice extent across the Greenland Ice Sheet from 2001 to 2017.

(A) End-of-season (or maximum) snowline elevation; (B) maximum bare ice extent. Gray shaded areas represent the uncertainty of both metrics (see Materials and Methods). Neither metric exhibits a statistically significant linear trend over the entire study period (P > 0.10), partly owing to low snowline elevation and bare ice extent in 2013 and 2017. However, snowline elevation and bare ice extent increased significantly (P < 0.01) between 2001 and 2012, a period of declining albedo on the ice sheet often attributed to hydrological and/or biological processes that darken the ice sheet surface. Relationship between (C) snowline elevation and (D) bare ice extent with mean summer pan–Greenland Ice Sheet albedo. Both metrics are significantly correlated, indicating that the area of bare ice exposure and total ice sheet albedo are closely coupled.
