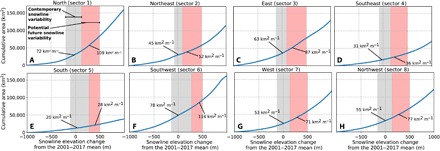
Fig. 4. Hypsometric surface elevation-area relationships for all eight IMBIE Greenland sectors.

Gray shaded areas indicate the observed range of snowlines and bare ice areas that we mapped using MODIS satellite imagery from 2001 to 2017. Red shaded areas indicate the estimated range of snowlines and bare ice areas that would occur if end-of-summer snowlines rise 500 m higher than the 2001–2017 mean. Labels summarize rate-of-change of bare ice exposure in units of area per meter increase in snowline (km2 m−1). All hypsometric relationships are computed using the Greenland Ice Mapping Project (GIMP) digital elevation model (37) and assume static, present-day surface topography. The exponential relationships suggest that strength of the snowline-albedo feedback reported here will become stronger in the future as snowlines rise to higher, flatter areas of the ice sheet, owing to increasing areas of bare ice exposed per unit rise in snowline elevation.
