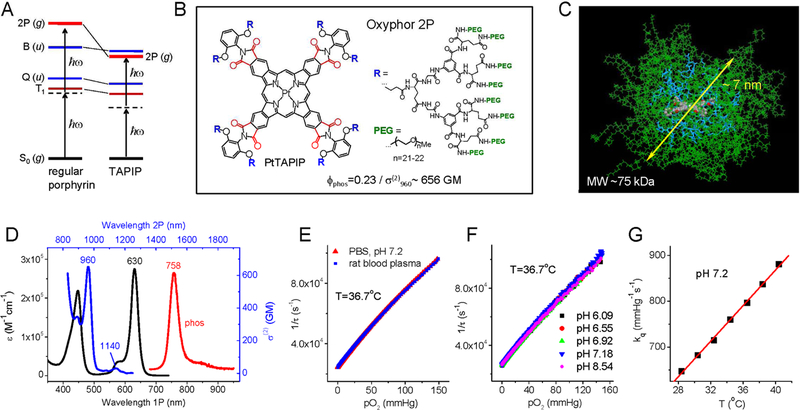
Figure 1.
Structure and properties of Oxyphor 2P. (A) Energy diagram showing low-lying electronic ungerade states (u-states), Q and B (Soret), in regular porphyrins (left) and in tetraarylphthalimidoporphyrins (TAPIP, right). In TAPIP a 2P-active grade state (g-state) is stabilized below the B state level, allowing for efficient 2P-excitation without overlapping with low vibronic sublevels of the triplet state (T1). (B) Structure of probe Oxyphor 2P, which is composed of PtTAPIP core, mixed glutamate/aryl-glycine dendrons and multiple peripheral PEG groups (see Supplemental Information for synthesis and characterization). In PtTAPIP, eight carbonyl groups (shown in red) are locked in plane with the porphyrin, ensuring high degree of conjugation with the macrocycle and maximal stabilization of the g-state. (C) Calculated structure (molecular mechanics, AMBER force field) of the probe molecule in water (modeled as dielectric continuum): core porphyrin (colored by atom), dendritic branches (blue), PEG chains (green). The average diameter of the semi-globular molecule is ~7 nm. (D) 1P (black) and 2P (blue) absorption and phosphorescence emission (red) spectra of Oxyphor 2P in water. The 2PA spectrum shows two maxima: 960 nm (656 GM) and 1140 nm (30 GM). (E) Stern-Volmer oxygen quenching plots of Oxyphor 2P in phosphate buffered saline (pH 7.1) and in rat blood plasma (T=36.7°C). (F) Stern-Volmer oxygen quenching plots of the probe at different pH levels. (G) The quenching plots (pO2 vs τ) were fit to a modified Stern-Volmer equation, pO2(τ)=1/(a×kq ×τp)+1/(kq×τ0), where τ0=38 μs (phosphorescence lifetime in the absence of oxygen) and empirical parameters a=14.8 and p=−1.26 are constants, while the oxygen quenching constant kq changes linearly with temperature (Supplemental Information).

