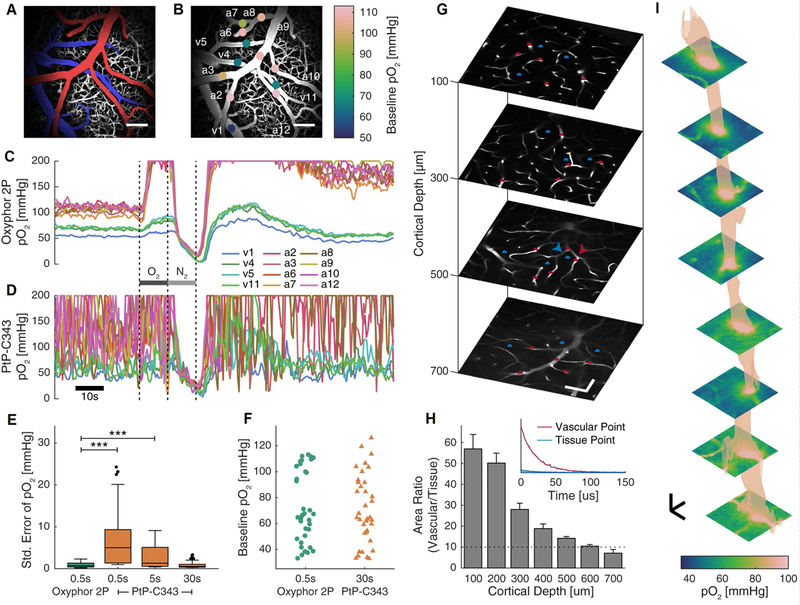
Figure 2.
Oxyphor 2P offers ~60 fold improvement in the temporal resolution over the previous probe PtP-C343 (Finikova et al., 2008) and allows imaging up to 600μm below the cortical surface in vasculature and tissue. (A) Maximum intensity projection of a 250μm-thick image stack of the cortical vasculature labeled with FITC-dextran and colored to highlight the major arterial (red) and venous (blue) branches, in a freely-breathing, lightly sedated mouse. Scale bar, 100μm. (B) The locations of the 12 points used in a mouse for pO2 measurements in c-d, color-coded to display the respective baseline pO2 values. The labels identify whether the vessel is an arterial (a) or venous (v) location. (C-D) Temporal profiles of pO2 values at the points labeled in b, in response to changes in the inspired gas from air to 100% O2 (dark grey bar) then 100% N2 (light grey bar). (E) Summary quantification of the average standard error in the pO2 measurements (example shown in C-D) during the baseline period, corresponding to different data acquisition times: 0.5s (150 phosphorescence decays averaged per location); 5s (1500 decays); 30s (9000 decays). See STAR Methods for data acquisition protocol. *** represents p < 0.001, linear mixed effects models. N = 36 locations in 3 mice. (F) Baseline pO2 when measured with Oxyphor 2P and PtP-C343 (p=0.72, linear mixed effects models). (G) Images of the FITC-dextran labeled microvasculature at increasing cortical depth, overlaid with measurement locations for phosphorescence decays in vessels (red) and the tissue (blue). Arrowheads indicate the points plotted in the inset in h. Scale bars, 50μm. (H) Main panel: Summary quantification of the ratio of area under the phosphorescence decay curves in the vasculature vs tissue. The dashed line (Area Ratio=10) indicates the threshold above which >91% of the detected photons originate in the focal point. Error bars represent s.e.m. N = 148 points from 7 regions across 3 mice. Inset: Phosphorescence decays measured at the points in (G) marked by arrowheads. Although Oxyphor 2P is not present in the parenchyma, some phosphorescence is detected, increasing with depth, which can confound localized measurements. (I) Selected images (separated by 75μm, interpolated for display purposes) and a 90mmHg isosurface derived from a high-resolution volumetric image stack measuring pO2 simultaneously in blood and tissue. Oxyphor 2P was injected into the cisterna magna in a minimally invasive manner and reached the tissue in the imaging region with the CSF (see main text and Supplemental Information). pO2 measurement image grids were recorded every 25μm in z from 0–600μm below the cortical surface. Scale bars: 25μm.

