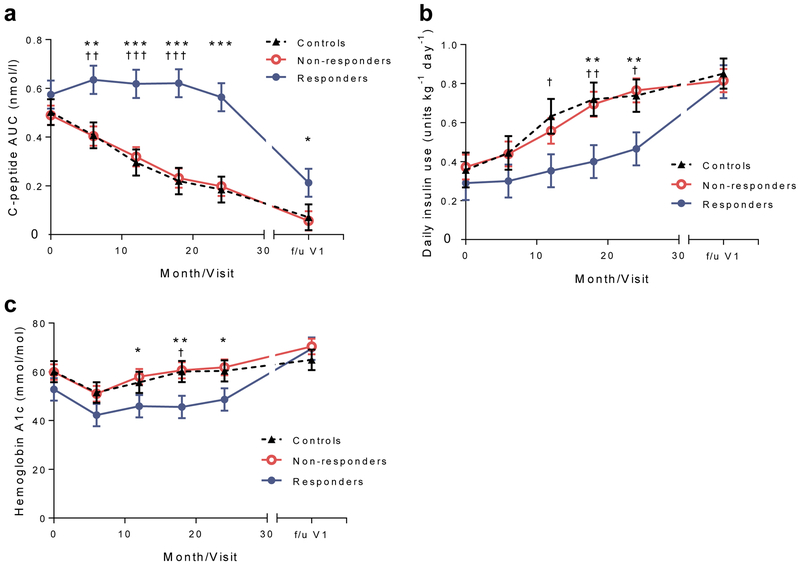
Fig. 2.
Metabolic responses to teplizumab treatment, (a) C-peptide response (loge [(AUC/240)+1], in nmol/l), (b) daily insulin use and (c) HbA1c levels during the AbATE trial period (in months) and at follow-up visit 1 (f/u V1) were compared in a mixed model. Means ± SEM from the mixed model are shown; *p<0.05, **p<0.01, ***p<0.001 for comparison of drug-treated responders vs drug-treated non-responders at each time point shown; †p<0.05, ††p<0.001, ††† p<0.001 for comparison of drug-treated responders and control participants at each time point shown

