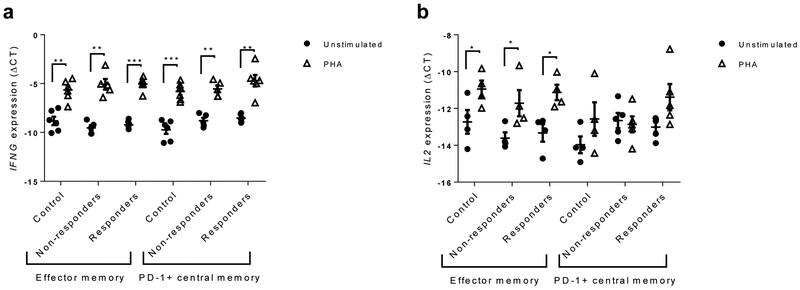
Fig. 5.
Cytokine responses of T cell subsets. IFNG (a) and IL2 mRNA expression (b) after 24 h was measured in CD8+ effector memory and PD-1+CD8+ central memory T cells stimulated with PHA, or unstimulated (expressed as ΔCt compared with actin). Data are means ± SEM; *p<0.05, **p<0,01, ***p<0.001, paired Student’s t test. For IFNG, n=6 for control and drug-treated responder groups and n=5 for drug-treated non-responder group; for IL2, due to very low expression of IL2 in some samples, n=4 for control group and n=4 for effector memory and n=5 for PD-1+CD8+ central memory T cells for the drug-treated responder and non-responder groups

