Figure 3.
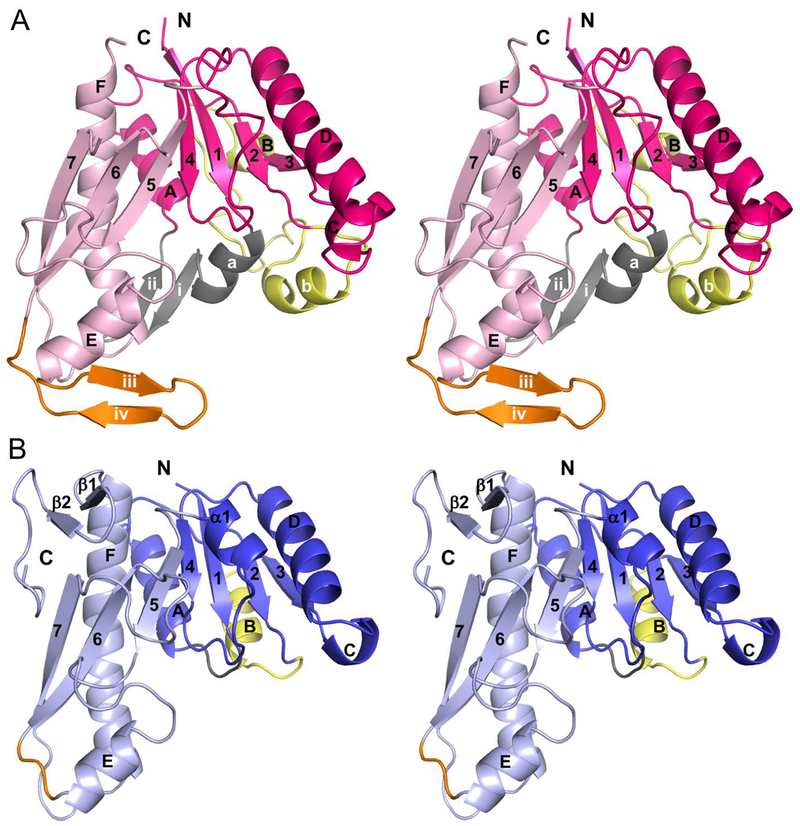
Walleye stereoimages showing monomer topology comparison between PvdF and EcGART. (A) While the formyltransferase fold and core of these proteins is similar, PvdF contains three major insertions sites respectively colored in gray (residues 12–34, helix a, strands i and ii), yellow (residues 63–102, loop and helix b) and orange (197–214, strands iii and iv). The N-terminal domain of PvdF (residues 1–162) in shown in magenta and the C terminal domain is in light pink (residues 163–275). (B) The N-terminal domain of EcGART (residues 1–100) is shown in dark blue and the C terminal domain is in light blue (residues 101–209). Insertion sites are represented in same colors as in panel A. EcGART contains structural elements that are not seen in PvdF, helix α1 and terminal sheet β1- β2. Helices are labeled with letters and sheets are indicated in numbers.

