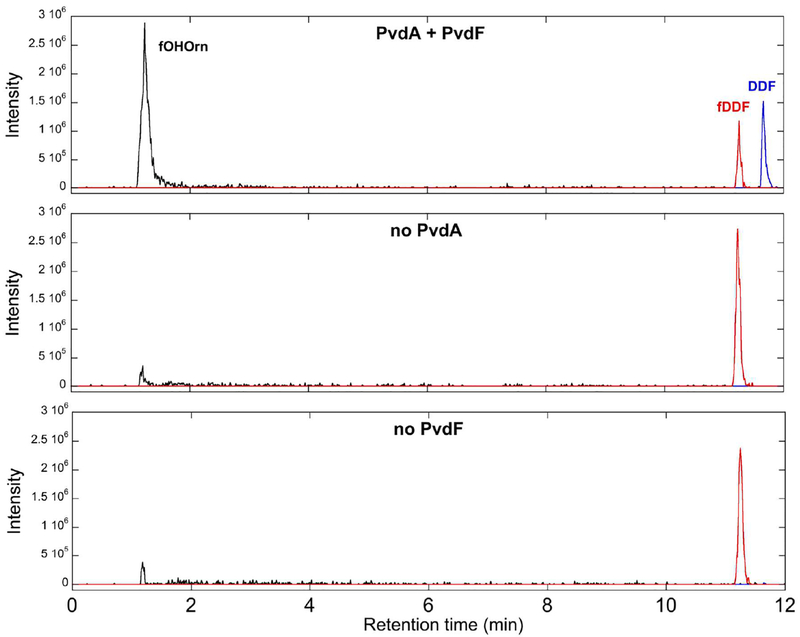
Figure 7.
The formation of the product fOHOrn was monitored by LCMS (black trace, m/z=177.0), along with DDF (blue trace, m/z=438.1) and fDDF (red trace, m/z=466.2). Unlike in the control samples (lower two panels), the complete reaction (top panel) shows clear formation of the product by catalytic formyl group transfer.

