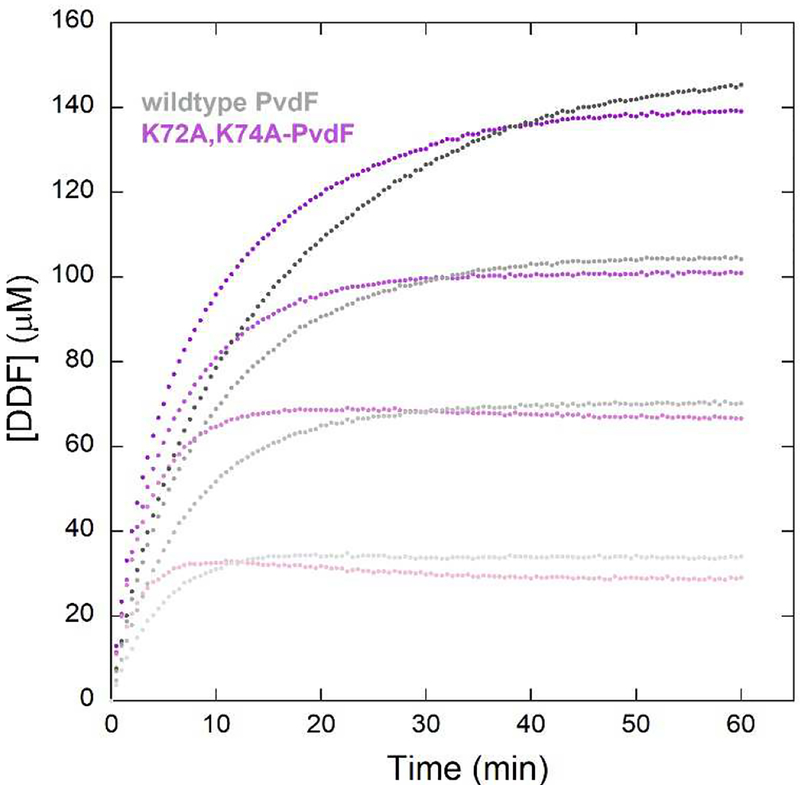
Figure 8.
Progress curve comparison between the wild type (shade of grey) and K72A, K74A-PvdF variant (shades of purple/pink). The curves represent four concentrations of fDDF (from light to dark shades). The K72A,K74A-PvdF does not crystallize, suggesting that the crystallographic binding site for DDF is disrupted. The variant is more active than the wildtype, suggesting that the catalytic binding site for the folate is not what is observed in the structure.

