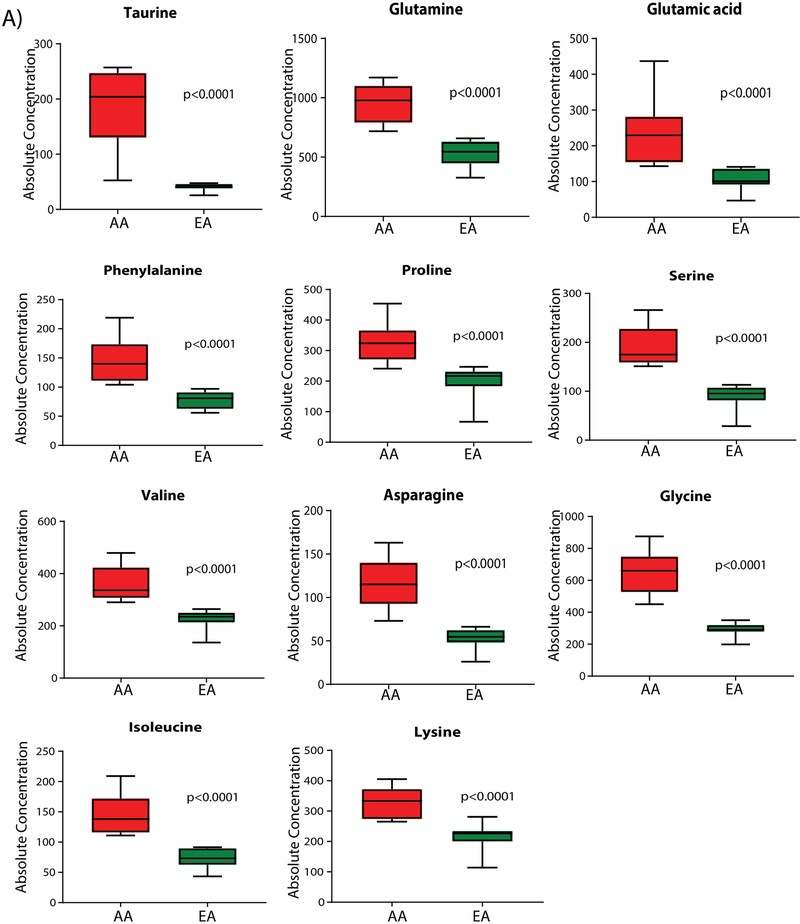
Figure 4. Absolute quantification of differential serum metabolites in AA and EA BLCA. Shown is the relative abundance of a subset of metabolites with differences between AA and EA patients.
Box plots of absolute concentrations (μM) of 11 elevated metabolites in AA BLCA serum, compared to EA BLCA serum, measured by Biocrates AbsoluteIDQ kit p180.

