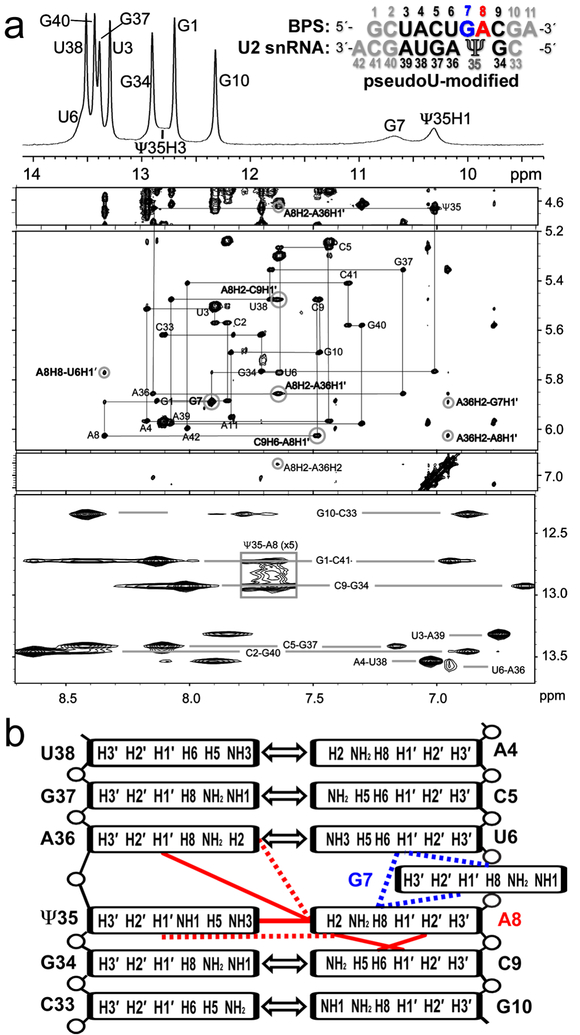
Fig. 1.
NOESY spectra indicate an intrahelical adenosine (A8) at the expected branch site and a partially syn conformer for the preceding guanosine (G7) for the pseudouridine (Ψ)-modified U2 snRNA – BPS duplex. (a) Top panel: One-dimensional spectrum of the imino protons at 0 °C. The RNA sequences are inset (expected branch site A8, red; preceding G7, blue; other consensus sequences, black; terminal nucleotides to facilitate NMR analysis, grey). Four lower panels: Two-dimensional NOESY spectra of the aromatic/amino region of the pseudouridine-containing duplex in 100% D2O at 15 °C with 400 ms mixing time (panels spanning 4.5–7.1 ppm) and in 95/5% H2O/D2O at 0 °C with 50 ms mixing time (bottom panel). Gray lines in the D2O NOESY trace the H8/6-H1′ backbone walk with intra-residue peaks labeled. Cross-peaks between G-imino and C-amino protons and between U-imino and A-H2 protons indicating Watson-Crick base-pairs are connected by light gray lines in the H2O NOESY. Key peaks for defining the branch site conformation are circled and labeled in bold font. Contours in the boxed region of the H2O spectrum are drawn five-fold lower than in the rest of the spectrum to show the Ψ35H3-A8H2 cross-peak. (b) Diagram of major branch site interactions: Double-headed arrows, canonical Watson-Crick base-pairs; blue lines, NOESY interactions used to determine the relative position of G7; red lines, NOESY interactions used to identify the relative position of A8. Dashed lines represent weak NOEs.

