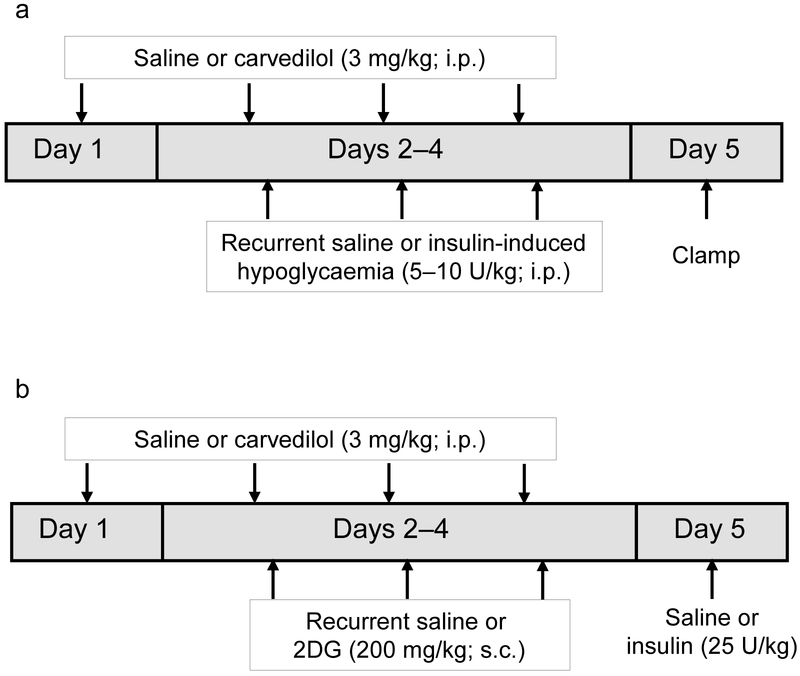
Fig. 1.
Study design. (a) Schematic diagram showing carvedilol and recurrent saline or insulin treatment during days 1–4. All animals underwent a hypoglycaemic clamp on day 5. (b) Schematic diagram showing the 2DG treatment regimen. Carvedilol and 2DG were administered from day 1 to 4. On day 5, insulin was given to induce hypoglycaemia and total food consumption (g) in response to the hypoglycaemic challenge was measured over 4 h

