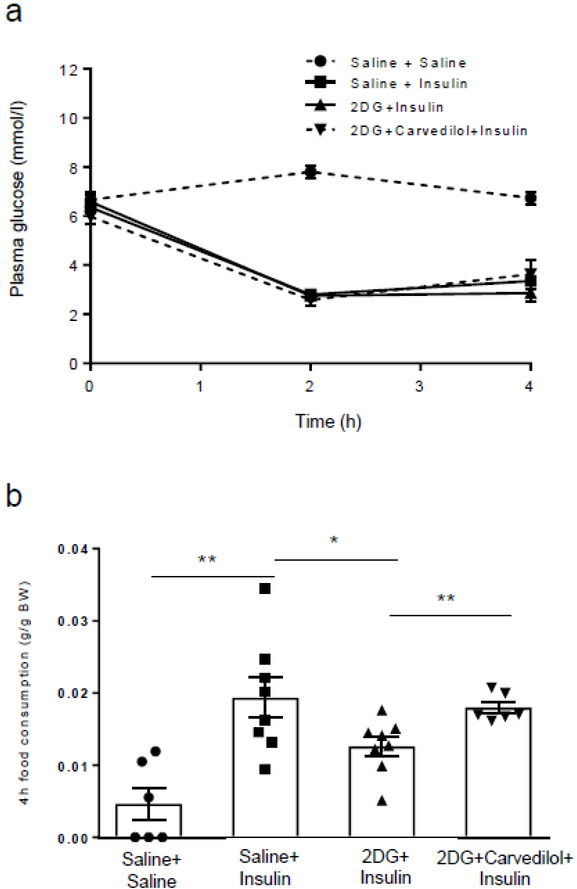
Fig. 4.
Evaluation of hypoglycaemia awareness. (a) Plasma glucose levels during the induction of hypoglycaemia on day 5. (b) Hypoglycaemia-naive rats made hypoglycaemic (saline + insulin; n=8) on day 4 consumed more than four times more food than hypoglycaemia-naive rats given a saline injection (saline + saline; n=6) (**p<0.01, saline + insulin vs saline + saline). Rats treated with 2DG (2DG + insulin; n=8) ate 35% less food when hypoglycaemic compared with the saline + insulin group (*p<0.05, 2DG + insulin vs saline + insulin). In contrast, when the 2DG animals were treated with carvedilol (n=6), the animals consumed as much food as the insulin group (**p<0.01, 2DG + insulin vs 2DG + carvedilol + insulin). Data were analysed using one-way ANOVA with post hoc Tukey honest significant difference (HSD) test and presented as mean ± SEM. BW, body weight

