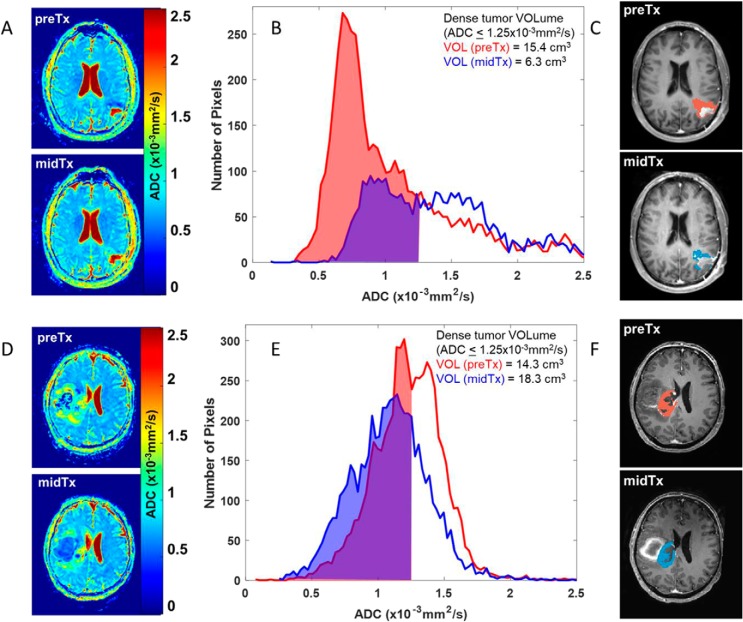
Figure 1.
Left vertically arranged images (A, D) show ADC maps for preTx and midTx imaging time-points of 2 patients with glioma that responded favorably (A) and did not responded (D) to chemoradiation therapy. Common scale for the ADC maps is indicated by the color bar. The center panes (B, E) illustrate the corresponding tumor volume ADC histograms (preTx: red, and midTx: blue) and tumor voxel volumes (filled) below ADC threshold of 1.25 (×10−3 mm2/s). The corresponding integrated volumes of the dense tumor are listed in the legend. The spatial location of thresholded histogram voxels is overlaid in red and blue on a single representative slice of each patient preTx and midTx T1Gd images on the right in (C, F), used as a reference for tumor ROI definition.

