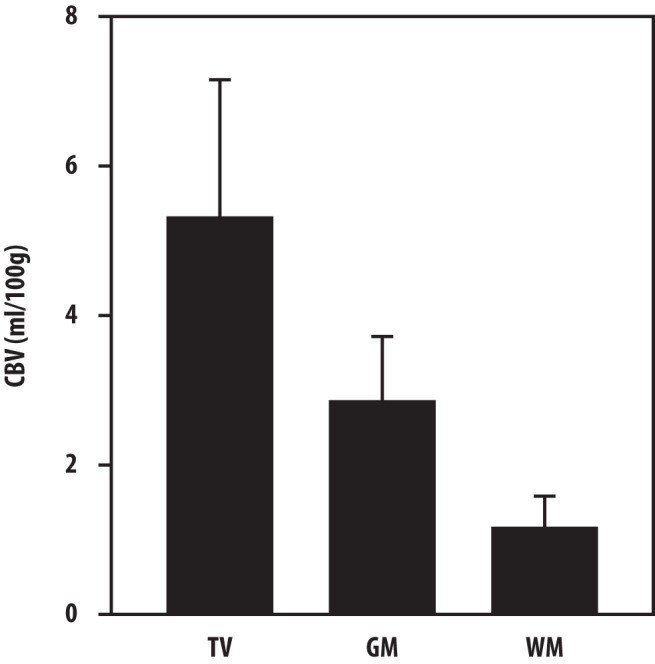
Figure 2.

The averaged CBV values in the hCBV tumor volumes, normal frontal white matter (WM) and normal frontal gray matter (GM) in the 12 study patients. The error bars depict the averaged standard deviations of cerebral blood volume (CBV) in the 3 volumes of interest across the 12 patients. Note that the mean CBV value + 2SDs in the frontal WM is smaller than the mean value in the frontal GM, and thus, it cannot be used as a threshold value to define the elevated CBV in the tumor volume.
