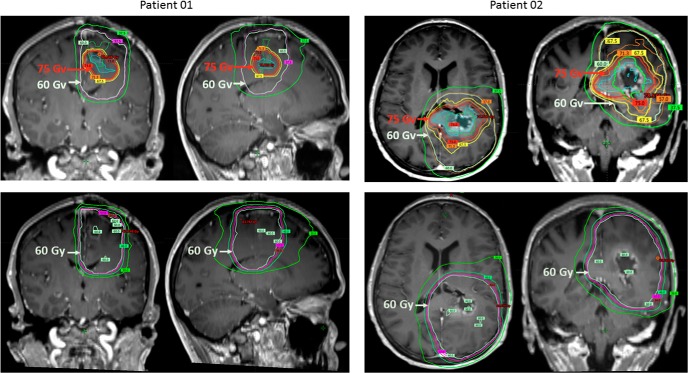
Figure 4.
Representative images from radiation plans from 2 different patients. The top row depicts images of radiation plans using advanced MRI to boost tumor subregions to 75 Gy. High-risk tumor targets are identified by advanced MRI (cyan) beyond the abnormal regions seen on T1 Gd-enhanced conventional MRI (green). The conformal 75-Gy isodose line targeting the advanced imaging tumor volume is depicted in red, and the larger 60-Gy isodose line targeting the anatomic T1-Gd-enhanced region with standard clinical margins is depicted in gray-white. The bottom row depicts images of comparison standard radiation plans for the same patients based on anatomic T1-Gd-enhanced MRI with standard clinical margins prescribed to 60 Gy. As showed, advanced MRI-identified boost regions prescribed to 75 Gy were often contained within standard anatomic MRI regions prescribed to 60 Gy.

