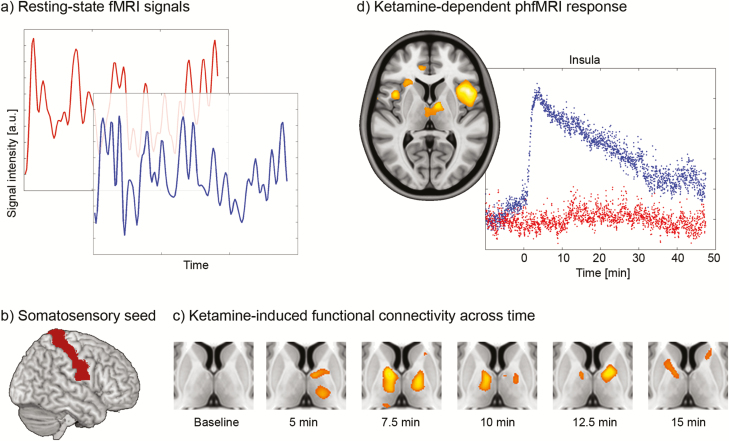
Figure 3.
Functional connectivity obtained from functional MRI. (a) Resting-state signal time course of 2 different brain regions from the default mode network (red, posterior cingulate cortex; blue, medial prefrontal cortex). The temporal correlation of these signals is used as index of functional connectivity. (b) Anatomical seed regions of large cortical regions (here the somatosensory cortex) can be used to map small thalamic nuclei. (c) Using the seed region in b, changes in functional connectivity following an acute i.v. challenge of ketamine compared with placebo reflect those seen in schizophrenia patients (reprinted by permission from Springer) (Hoflich et al., 2015). (d) Pharmacological functional MRI (fMRI) shows that neuronal activation followed that of ketamine plasma levels in the insula, anterior cingulate, and thalamus. Scatterplot shows an exemplary time course of the insula with ketamine and placebo response in blue and red, respectively (reprinted by permission from Oxford University Press) (Hoflich et al., 2017).

