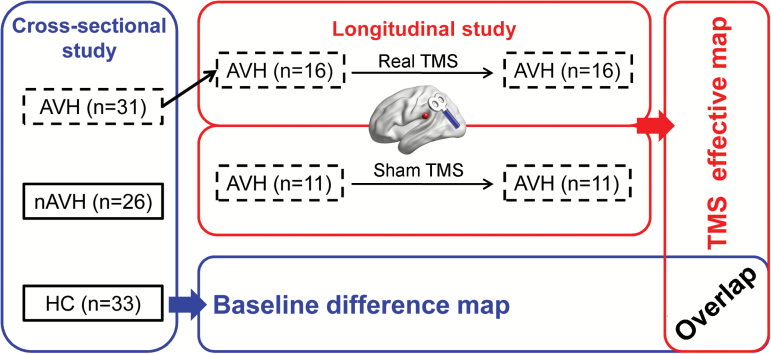
Fig. 1.
Experiment design and analytic strategy. Sixteen of 31 AVH patients in the cross-sectional study received real rTMS treatment. After rTMS treatment, 11 AVH patients were recruited to represent a control group in the longitudinal study. Notably, their imaging data were acquired using different scanners (albeit the same brand) than the other groups. The “overlap” represents a spatial overlap map of significant clusters from cross-sectional and longitudinal studies.

