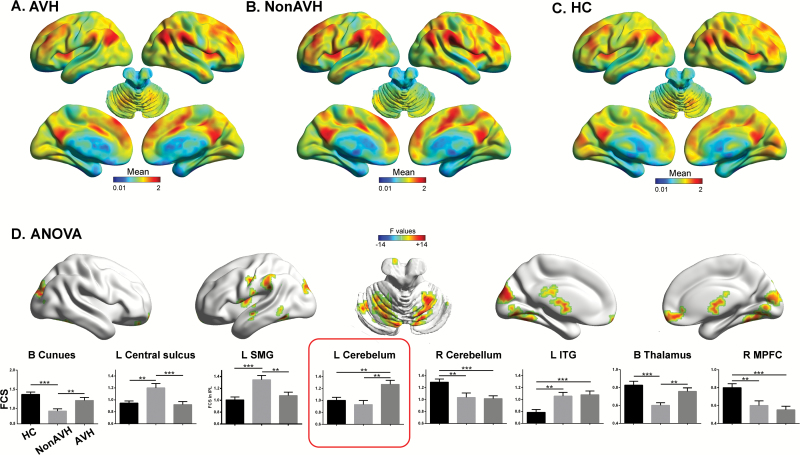
Fig. 2.
One-way analysis of variance of functional connectivity strength (FCS) maps in the cross-sectional experiment. Mean maps of FCS are illustrated for schizophrenia patients with auditory verbal hallucinations (AVHs) (A), non-AVH patients (B), and healthy controls (C). Significant clusters were found in 8 brain areas (D). Post hoc findings are illustrated by bar graphs (E; error bars indicate SEM; **P < .01, ***P < .001). L, left; ITG, inferior temporal gyrus; MPFC, medial prefrontal gyrus; R, right; SMG, supramarginal gyrus.

