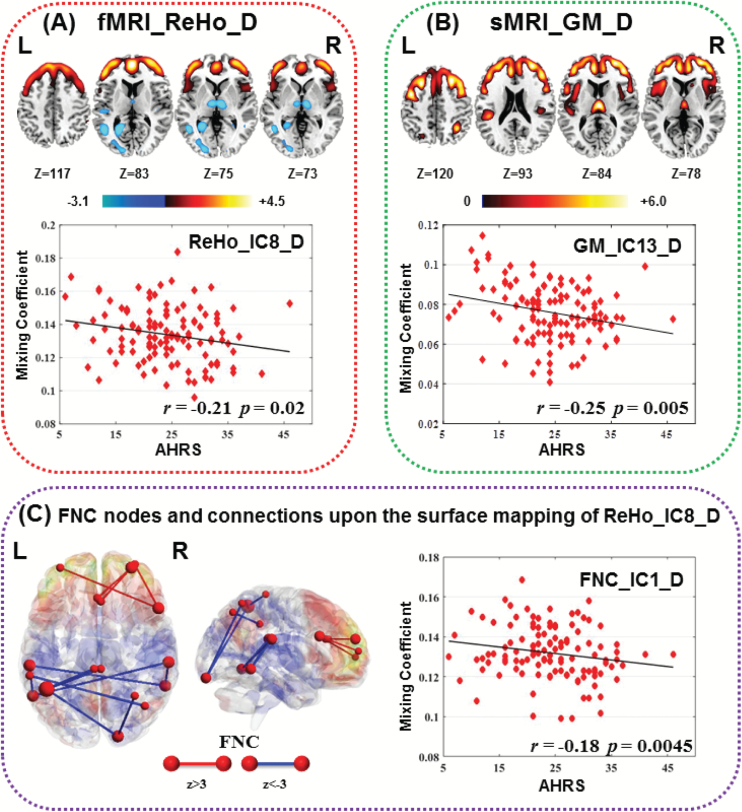
Fig. 3.
Spatial maps and scatter plot of the 3 components significantly correlated with Auditory Hallucinations Rating Scale (AHRS). (A) Regional homogeneity (ReHo) IC8; (B) gray matter (GM) IC13; the spatial maps (top) of ReHo and GM were visualized at |Z| >2.5, with the positive Z scores shown in red. (C) Functional network connectivity (FNC) IC1: the FNC component was also transformed into Z scores and visualized by BrainNet Viewer, in which red nodes are key nodes thresholded at |Z| >3 (the node size denotes FNC degree), and red lines means healthy controls (HCs) have higher functional connectivity (FC) strength than schizophrenia (SZ), while blue lines means HCs have lower FC strength than SZs. These edges and nodes of FNC_IC1 were mapped upon the surface mapping of ReHo IC8 in (C), indicating a high coherence between ReHo and FNC component associated with AHRS, while all 3 components demonstrate high spatial consistence.

