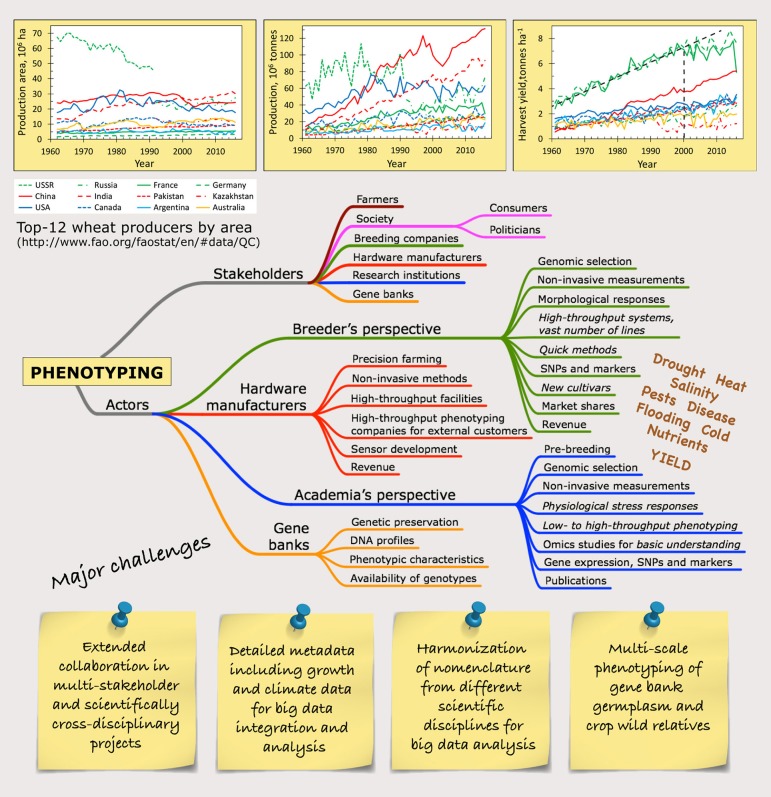
Figure 1.
Bulletin board drawing up the current landscape of phenotyping. The development of global crop production, exemplified by the top-12 wheat producers, show that the increase in harvest yield is leveling off since year 2000 in high-yielding areas, while many big producers in terms of area and production already today suffer from environmental limitations as seen in the intermediate to low harvest yields. The mind map of the stakeholders and actors of phenotyping gives a simplified picture of the vast heterogeneity in the phenotyping community, where each focus point can be divided into all different biotic and abiotic stress factors that may be studied. Some major challenges for the years to come are posted. The lines for the top-12 wheat producers are green for Europe (USSR – narrow dashes, Russia – dash/dot, France – solid line, Germany – wide dashes), red for Asia (solid line – China, wide dashes – India, narrow dashes – Pakistan, dash/dot – Kazakhstan), dark blue for North America (solid line – USA, narrow dashes – Canada), light blue for South America (solid line – Argentina) and orange solid line for Australia.

