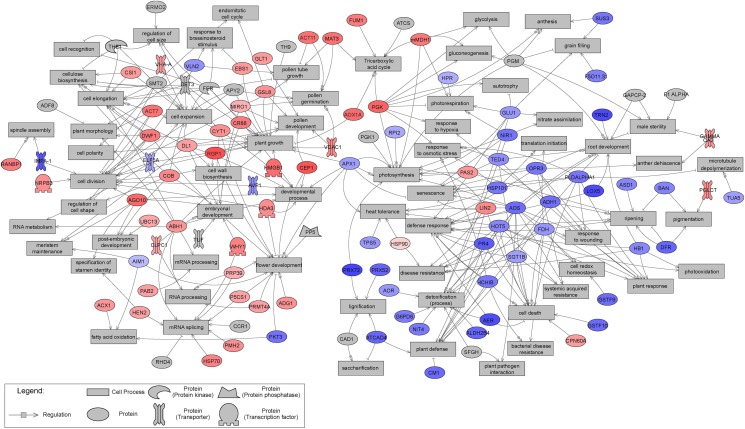
FIGURE 11.
Mapping of significantly differentially expressed (P < 0.05) transcripts to sub-network generated from proteomics studies and presented in Figure 10. This transcript Sub-Network Enrichment Analysis (SNEA) map connects transcripts and regulators or targets in isogenic embryonal mass (EM) and non-embryogenic callus (NEC) of three genotypes (SD4-8, TD15-1, TD17-1) of Douglas-fir in the proliferation phase of somatic embryogenesis. The transcripts are named according to homologues in Arabidopsis. The correspondences between Douglas-fir and Arabidopsis gene names are given in Supplementary Table S4. Red and blue indicate enrichment in EM and NEC, respectively, and the colors’ intensities indicate relative transcript expression levels.

