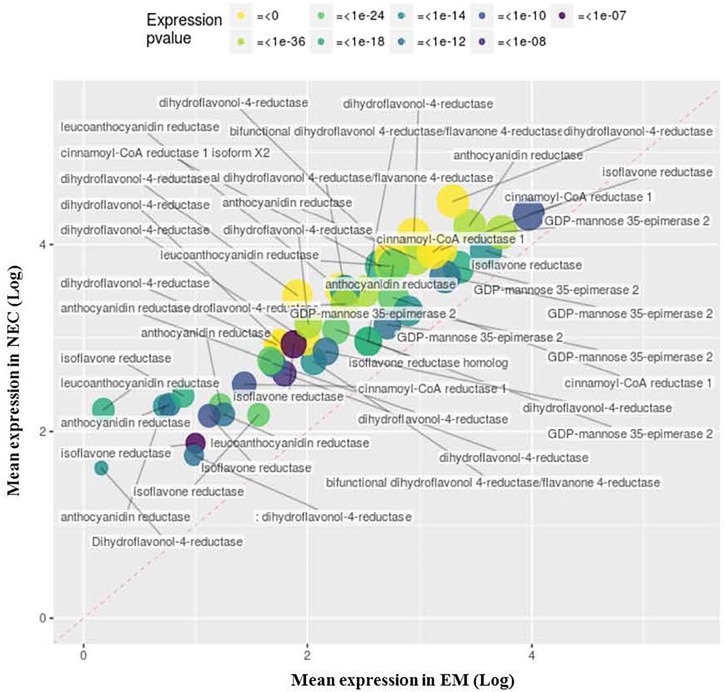
FIGURE 7.
Upregulated transcripts in NEC (relative to EM) annotated to MF GO:0003854, “3-beta-hydroxy-delta5-steroid dehydrogenase activity.” Expression values are normalized mapping scores from DESeq2 analysis: means for NEC and EM obtained from analyses of 16 and 21 samples, respectively. Transcript labels are from annotations obtained by Blast2GO. The dashed red line indicates non-differential expression between EM and NEC. Differential expression p-values are color-coded, and sizes of dots are proportional to mapping scores.

