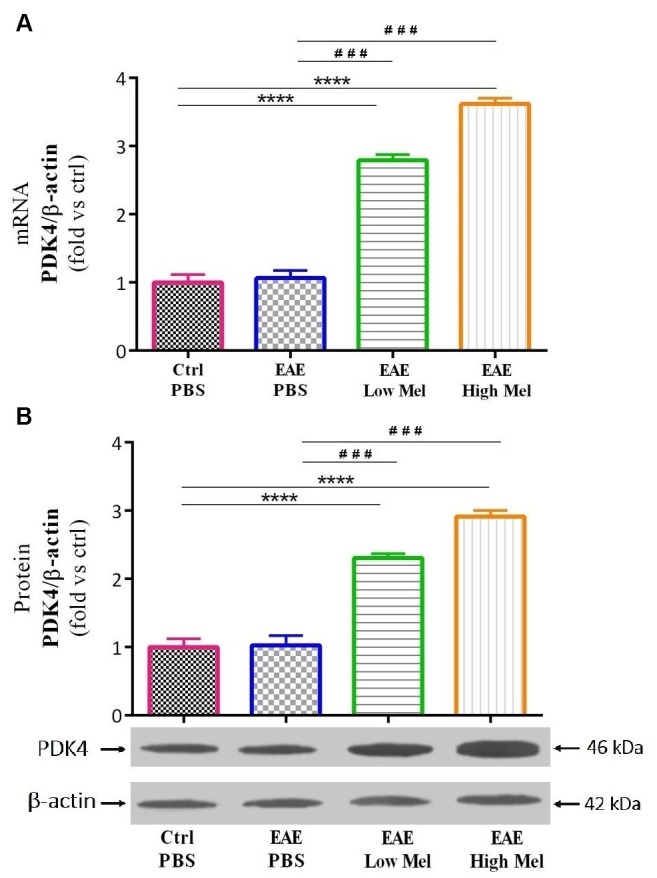
FIGURE 6.

The effects of melatonin on PDK4 levels in brain homogenate. (A) mRNA expression levels of PDK4 assessed by real time-PCR. (B) Protein expression levels of PDK4 assessed by western-blot. β-actin was used as an internal control for normalization for both real time-PCR and western blot. Quantification PDK4 expression levels was normalized to controls. Values are expressed as the Mean ± SEM. Each group included 8 mice (n = 8). Statistical analysis was performed by one-way analysis of variance (ANOVA) followed by Tukey’s test. Significance is indicated by ∗∗∗p < 0.001 and ∗∗∗∗p < 0.001 vs. control-PBS and ###p < 0.001 vs. EAE-PBS.
