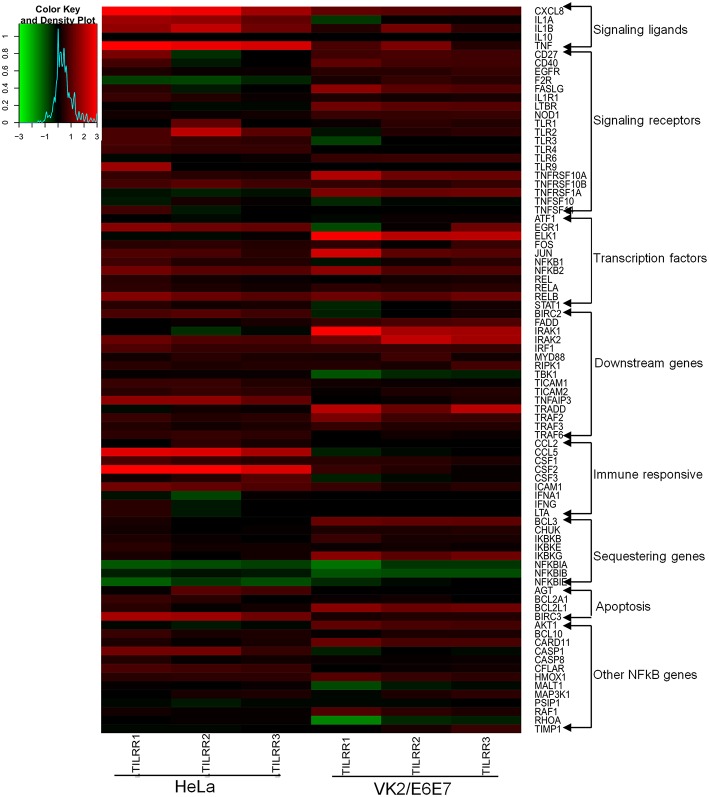
Figure 5.
Heat map presentation of up- and down- regulated genes in NFκB pathway for the presence of TILRR. Log2 fold changes of gene expression in HeLa and VK2/E6E7 cells generated by RStudio (https://www.rstudio.com). Gradient red color indicates the up-regulated genes; gradient green represents the down-regulated genes. Solid black means baseline, which represents the fold change 1 or log2 = 0 (control). “X” axis showing the triplicate biological samples for each cell line, “Y” axis (right side) represents the 84 tested genes categorized into different groups. Legend on the upper left side shows the scale of log2 fold change.

