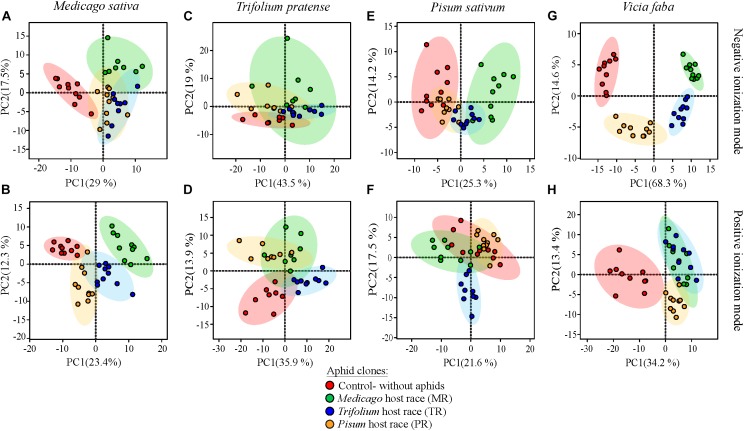
FIGURE 3.
PCA plots of metabolic features of leaves of pea aphid host plant species before and after infestation by three different aphid host races. Features are derived from UHPLC-Orbitrap mass spectrometry of aqueous methanol extracts conducted in negative (top row: A,C,E,G) and positive (bottom row: B,D,F,H) ionization modes for M. sativa (A,B), T. pratense (C,D), P. sativum (E,F), and V. faba (G,H). Only the 5% of metabolomic features that changed most are plotted. Small colored circles represent individual plant metabolic profiles after infestation with the MR (green), TR (blue), or PR (yellow) host race or of uninfested control plants (red). Colored ellipses represent the 95% confidence regions for each group.

