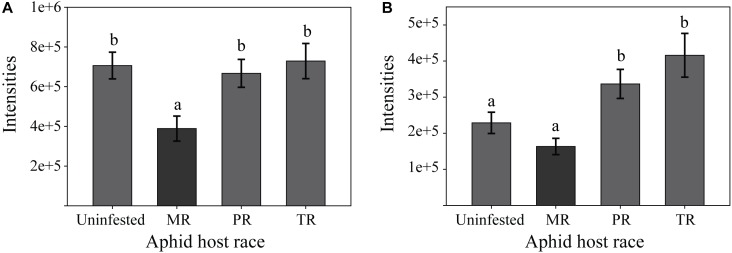
FIGURE 4.
Examples of pea aphid host plant metabolites from M. sativa that are decreased only after infestation with the native aphid host race (A) or that are significantly increased only after infestation with non-native aphid host races (B). (A) Metabolite with [M-H] − m/z 1085.55, was decreased only by the native MR host race. (B) Metabolite with [M-H]− m/z 605.19 was induced only by the non-native PR and TR host races. Both metabolites were detected in negative ionization mode. Bars represent means ± SE. MR, Medicago race; TR, Trifolium race; PR, Pisum race; Uninfested, uninfested control plants. Different letters indicate significant differences (P ≤ 0.05) based on One-way ANOVA followed by Tukey HSD test. MS and MS2 spectra of these two compounds can be seen in Supplementary Figure 2.

