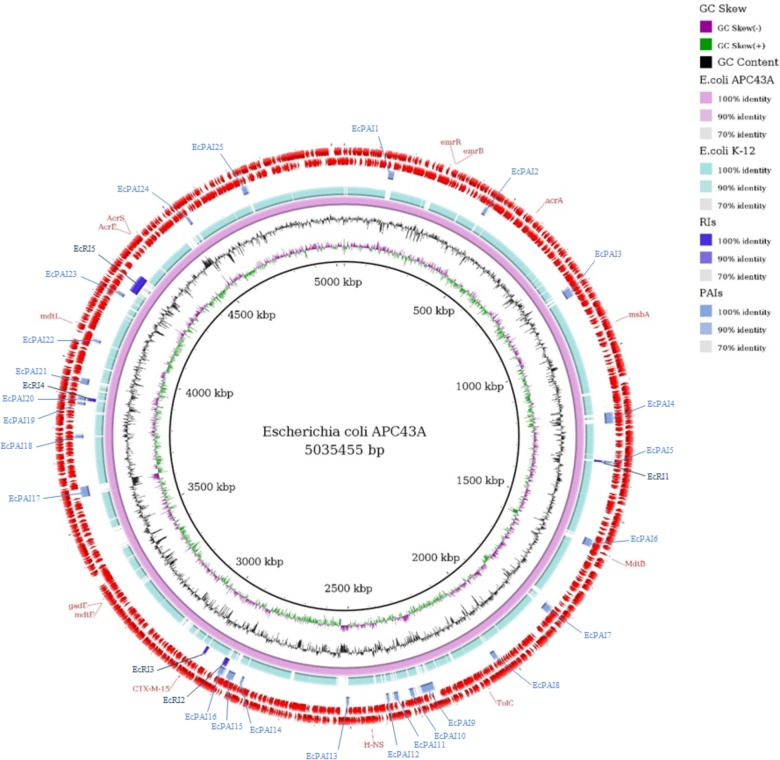
FIGURE 3.
Comparative genomic ring designed in Gegenees program. The innermost ring to the outermost is presented in this figure, as follows: GC skew and the GC content of E. coli APC43A; the genome sequence of E. coli APC43A and E. coli K-12; the Resistance Islands (RIs) detected by GIPSy; the Pathogenicity Islands (PAIs) detected by GIPSy; CDSs identified in the genome of E. coli APC43A. The location of the resistance genes detected by CARD and ResFinder are shown and identified by their respective names in red.

