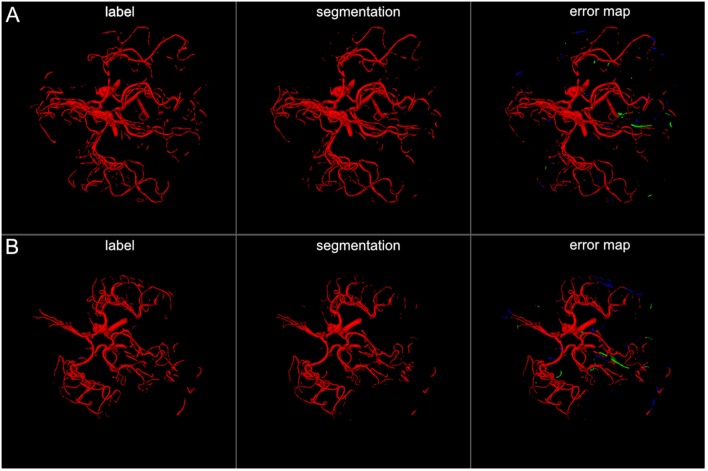
Figure 4.
3D projections of segmentation results. The figure illustrates exemplary segmentation results as 3D projections for two representative patients (A,B). Labels are shown in the first column and exemplary segmentation results are shown in the second column. The third column shows the error map, where red voxels indicate true positives, green voxels false positives, and blue voxels false negatives. Overall a high performance segmentation could be achieved. In the error maps it can be seen that false positives mainly presented as central venous structures and parts of meningeal arteries. (3D view is meant for an overall overview. Due to 3D interpolation, very small structures may appear differently in the images. This does not translate to real voxel-to-voxel differences. For direct voxel-wise comparison please use the 2D-images in Figures 5–8).

