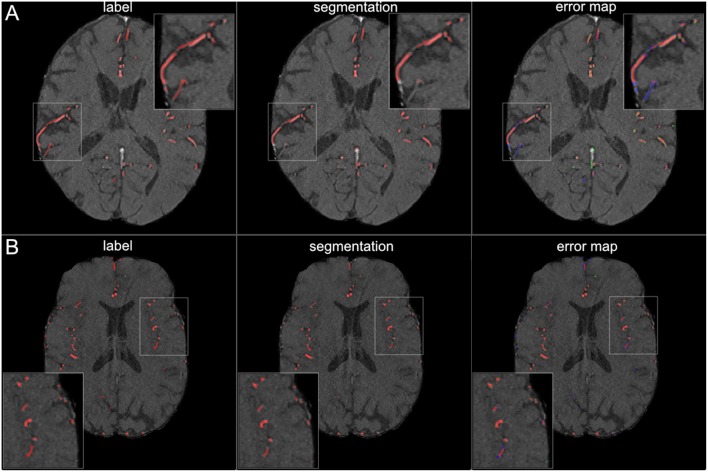
Figure 6.
Segmentation results for small vessels. The figure illustrates exemplary segmentation results for small vessels for two representative patients (A,B). Labels are shown in the first column and exemplary segmentation results are shown in the second column. The third column shows the error map, where red voxels indicate true positives, green voxels false positives and blue voxels false negatives. In 7 patients (50%) also small vessels were segmented well, with only few false negatives (B). In the other patients, the small vessels were segmented only sufficiently, with both false positives and false negatives (A).

