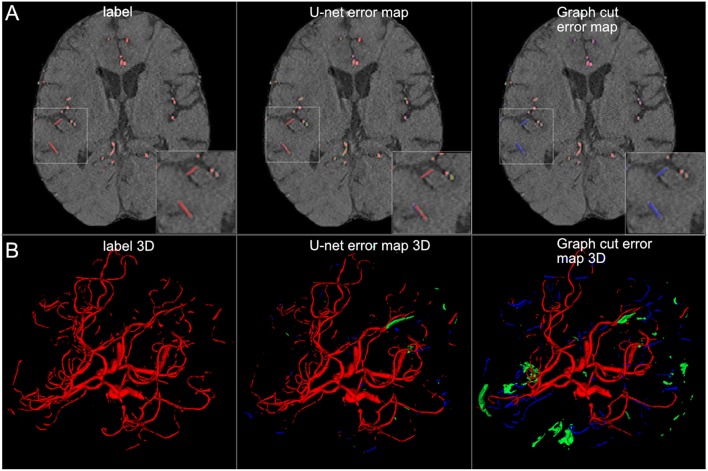
Figure 8.
Comparison of U-net and graph cut segmentations. (A) 2D comparison and (B) 3D comparison of labels, U-net error maps and graph cut error maps. The quantitative results are confirmed by visual inspection. The graph cut segmentation shows more false negatively (blue) and false positively (green) segmented voxels.

