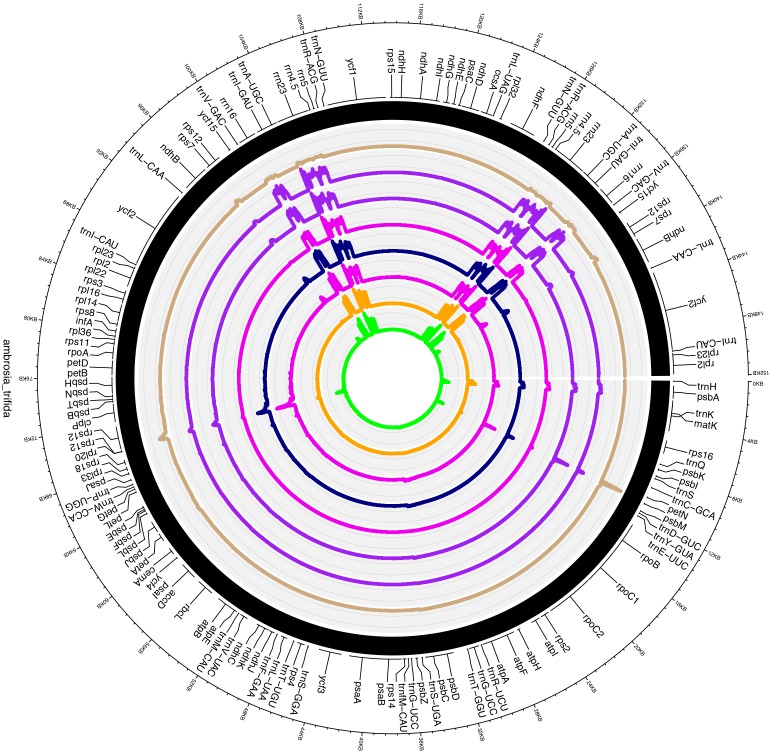
FIGURE 6.
Circos plot visualization of the transcriptional mapping of Ambrosia trifida. Single-base resolution of the mapped RNA-seq reads across the A. trifida plastome with represented gene annotations. Track ribbons order according to the following SRA accession number: SRR1661420, SRR1661463, SRR1661464, SRR1661465, SRR1661466, SRR1661467, SRR1661468 and SRR1661469.

