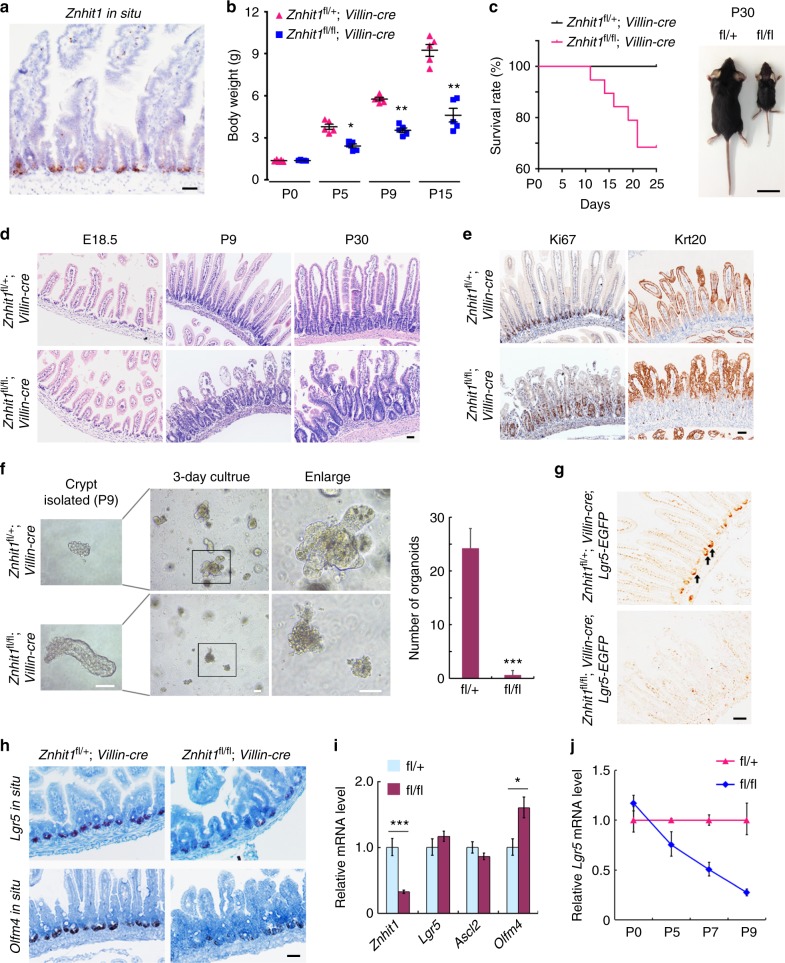
Fig. 1.
Znhit1 deletion disrupts postnatal generation of Lgr5+ ISC. a Znhit1 in situ was performed in intestinal section of 8-week-old C57BL/6 mouse. Scale bar, 50 μm. b Body weight comparison between Znhit1fl/+; Villin-cre and Znhit1fl/fl; Villin-cre mice at indicated time. The data represent mean ± s.d. (n = 5 mice per group). Wilcoxon’s rank sum test: **P < 0.01. *P < 0.05. c Kaplan–Meier survival curves of Znhit1fl/+; Villin-cre and Znhit1fl/fl; Villin-cre mice (n = 19 mice per genotype) and body size comparison between survived mice at P30. Scale bar, 2 cm. d Paraffin-embedded intestine tissues were stained with hematoxylin and eosin. e Ki67 and Krt20 staining of intestinal sections from Znhit1fl/+; Villin-cre and Znhit1fl/fl; Villin-cre mice at P9. f Intestinal crypts were isolated from Znhit1fl/+; Villin-cre and Znhit1fl/fl; Villin-cre mice at P9, embedded in Matrigel (100 crypts per well) and cultured for 3 days. The statistical analysis of organoid numbers (n = 5 mice per genotype) was shown as mean ± s.d. Student’s t-test: ***P < 0.001. g GFP staining of intestinal sections from Znhit1fl/+; Villin-cre; Lgr5-EGFP-IRES-creERT2 and Znhit1fl/fl; Villin-cre; Lgr5-EGFP-IRES-creERT2 mice at P9. Arrows: Lgr5+ ISCs. h Lgr5 and Olfm4 in situ were performed in intestinal sections at P9. i Intestine was harvested from Znhit1fl/+; Villin-cre (fl/+) and Znhit1fl/fl; Villin-cre (fl/fl) mice at P0 to examine the expression of Znhit1, Lgr5, Ascl2, and Olfm4 using qRT-PCR. j Intestine was harvested from Znhit1fl/+; Villin-cre (fl/+) and Znhit1fl/fl; Villin-cre (fl/fl) mice at indicated time to examine Lgr5 expression using qRT-PCR. For qRT-PCR, histone H3 was used as an internal control. The statistical data represent mean ± s.d. (n = 3 mice per genotype). Student’s t-test: ***P < 0.001. *P < 0.05. All images are representative of n = 3 mice per genotype. Scale bar, 50 μm

