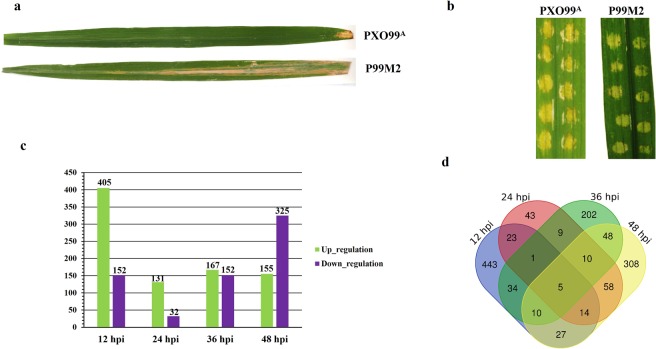
Figure 1.
(a) Comparative phenotype of the CBB23 leaves after PXOO9A and P99M2 inoculations. Photographs were taken 15 days of post inoculation. (b) Inoculations of PXO99A and P99M2 bacterial strains via needleless syringe. Photographs were taken 4 days of inoculation. (c) Regulation of DEGs at different time periods in PXO99A inoculated leaves relative to P99M2. Up and down-regulated genes are shown in green and purple color bars, respectively. (d) Venn diagram illustrating the overlapping of DEGs at different time points. Overlapping of DEGs at 12, 24, 36, and 48 hpi are shown in blue, red, green and yellow colors, respectively.

