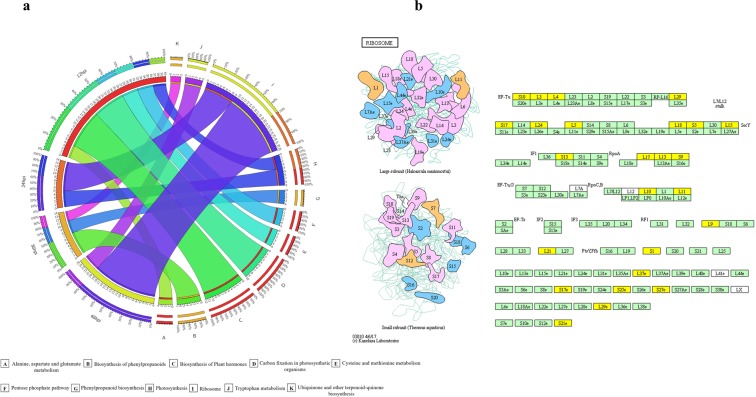
Figure 5.
KEGG pathway analysis of DEGs at different time points. (a) Circos exhibiting the significant (P-value ≤ 0.05) KEGG pathways at different time intervals. All the significant KEGG pathways are mentioned in different color ribbons. (b) KEGG pathway analysis related to the ribosome in the comparison of the PXO99A and P99M2 inoculated rice leaves. Green shade boxes indicate the genes expressing in rice; while yellow boxes are representing the up-regulated DEGs in PXO99A relative to P99M2 inoculation.

